Table of contents
Open Table of contents
Setup
A few facts about the environment:
- Terminal servers running Windows Server 2016
- Citrix (Delivery Controller, VDA, PVS) version 1912CU1
- PVS caching mode: Cache on device RAM with overflow on hard disk
- 10 out of 800 VDAs were affected daily
The Problem
The problem in detail: The VDAs reboot daily and immediately after that, everything works fine. After a certain time (sometimes after one hour, sometimes after 10 hours, and sometimes never), the VDAs become unresponsive.
“Becoming unresponsive” means that sessions on the server simply hang. Sometimes the entire machine would hang. Sometimes I could still log in to the machine, but everything was very slow. Most of the time, it was not possible to log in (regardless of whether it was a local user or a domain user). Citrix Director no longer showed current data about the machine.
First Clue
After a few days, I was finally able to log in to one of the machines. I opened Explorer and looked at the disks. After about 3 hours of waiting, I finally saw Explorer and noticed that the D:\ disk was (almost completely) full. The largest file was vdiskdif.vhdx.
Troubleshooting
From this point on, I knew that something was filling up the vDisk cache, but I didn’t know exactly what. In theory, it would be practical to see what exactly is trying to write to C:\ to understand why the vDisk cache is filling up. I don’t really know a (resource-friendly) tool to accomplish this — Process Monitor can do it, but running it continuously is not an option (that would bring the system down even sooner). And even if I wanted to, running ProcMon on 800 production servers is not a good option.
After the machine became unresponsive, I generated a full memory dump. I’m not very experienced with analyzing such memory dumps, but let’s see if it leads us somewhere.
Analyzing the Memory Dump
- First, we need WinDbg. The easiest way is to download WinDbg Preview via Microsoft Store.
- Next, we need to set up the symbol server so we get readable output. A simple and sensible method is to set the environment variable:
_NT_SYMBOL_PATH=SRV*C:\symbols*http://msdl.microsoft.com/download/symbols. The good thing is that other tools also use this environment variable for the correct symbol server configuration. - Download the WinDbg extension: DbgKit by Andrey Bazhan (since the original website is offline, here’s my mirror link).
- Open WinDbg and load the memory dump (File > Open dump file).
- Load the debugger extension:
.load DbgKit\x64\dbgkit64.dll(the path may need to be adjusted). - Once the CLI is available in WinDbg, enter the following command:
!dbgkit.mm. - An additional window opens. This takes a few minutes. Time for a caffeinated beverage of your choice.
Analysis Results
The “File Summary” tab is the most useful in our case. I had several memory dumps (around 5) but only saw two different patterns.
The First Pattern
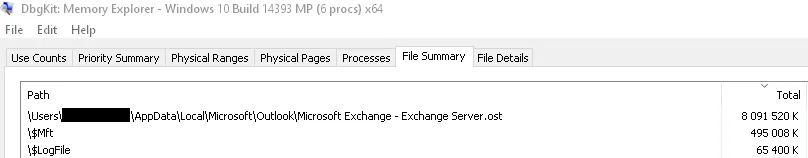
This is very interesting — an .ost file is only created when Outlook is running in “Offline Mode.” Typically, you enable “Online Mode” in a non-persistent environment (as is common when using Citrix PVS). We had migrated to Microsoft Office 2016 two weeks prior and hadn’t enforced Online Mode via GPO. From that point on, we enforced it (again).
The Second Pattern
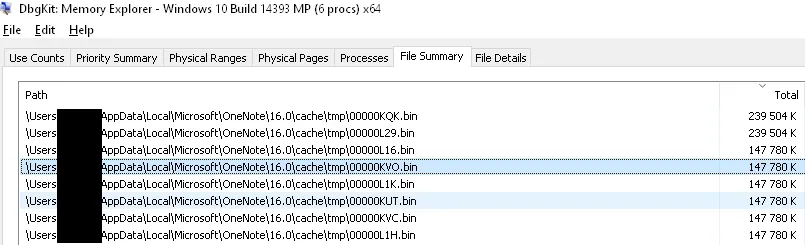
OneNote creates a large number of (and in the screenshot you can only see some of them) binary cache files. There is no way to disable this. There are some articles online describing how to improve the situation using Symlinks. However, I see other drawbacks from using/implementing such a symlink solution.
Closing Words
After we identified and resolved/worked around these two problems, we had no more corrupt VDAs. I tried to show a straightforward way to analyze such a problem, and there are probably many other ways to approach the analysis.
Happy troubleshooting.